Ten Years
It’s been ten years that this “blog” is up and running.
When I first set up my blogging system, I gave it another name (I didn’t like the termn “blog” or “weblog” at that time): “Memos.” This section has gone now that the site has been redesigned, but I always liked this title better because it gives a more accurate picture of what all this stuff really is: Just a bunch of ideas jumbled together, for the most part, and several log entries to keep a record of my adventures with my many Macbook. Originally, it looked like this (as of November 2017 from the Way Back Machine):
The design of my website was probably a bit crappy but I liked it a lot. This was a “responsive” CSS (for what that meant in 2010) with very little sophistication (a grid layout, a top menu and just plain hyperlinks). The color scheme was inspired from the Context website, and I used Textpattern as my blogging engine for several years. No comment, no cookies, no Ads, no stats, just plain text. I never thought it would still be alive 10 years later, but here we are. I rarely read old entries, but when I happened to find one of this blog entries referenced somewhere on the internet I feel like I have done something, finally.
I don’t want to do any in-depth investigation regarding the statistics of this blog. The average number of posts per month would not be a good indicator since I occasionally stopped writing during long period of time. I never tracked the number of visitors or any kind of “conversion rate”-like statistics. I know there is little traffic here, and that’s ok. There is now 300 published posts in total (+ 10 draft posts, yet to be published), with an average length of 710 words (294,269 in total). I know this is small but that’s probably how I express myself best, at least in English which is not my native language. Anyway, blogging didn’t help me master English any better. In fact, I never took a single course (even at school) and I learned what I could by reading blog posts and papers, and speaking with lenient and polite persons when attending scientific conferences.
How did I get the above numbers? I simply used some command-line utilities like this (it is a little biased because it includes YAML or TOML header, but that is barely a dozens of words):
wc -w *.md | awk -F' ' '{print $1}' | sed '$d'
Statistics can be collected using R by adding the following pipe:
| Rscript -e 'summary(as.numeric(readLines("stdin")))'
The same logic could be used to plot an histogram of the data, unless you want it the harder way. Here it is, with Gnuplot:
| gnuplot -p -e "set terminal png size 600, 300; set output '~/plot-posts.png'; \
  binwidth=150; bin(x,width)=width*(floor(x/width)+0.5); plot '<cat' \
  using (bin(\$1,binwidth)):(1.0) smooth freq \
  with boxes fs solid 0.25 lc rgb '#C7254E' notitle"
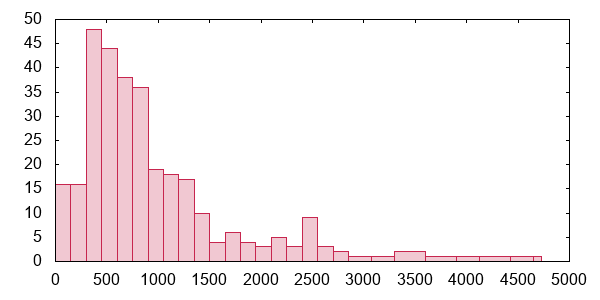
The longest posts are not really that surprising: it is a “lost+found” archive of drafts and a bunch of paper abstracts. The shortest ones are one-liner life events and current drafts in progress.
All that remains is to hope that everything goes well and that I can continue these digital ramblings.
♪ Agnes Obel • Aventine