Data frames for Racket
Lately, I’ve been playing with another implementation of data frames in Racket: tabular-asa. The data-frame package by Alex Harsányi is the first one I used (one or two years ago) and I found it comfortable to use except it doesn’t handle categorical variables, but see my preceding review.1 This one doesn’t either, but it handles missing values, like the data-frame package, and grouping or aggregating functions are a bit more intuitive to use (no need to rely on an external index) and closer in spirit to the R or Python ecosystem.
Here is a toy example inspired by Travis Hinkleman’s recent post about his own implementation of data frame for Chez Scheme. Note that the NYC flights dataset is a 29 Mo file, so it stands for a relatively honest benchmark for Racket’s data processing capabilities. In what follows I am mostly interested in the time it takes to load such a dataset.
First, let’s try the default CSV reader. Hereafter I’ll be using a poor-man solution for timing the whole process of loading the dataset in Racket REPL (I’m using Racket 8.6 [cs]). As a result, the data will not be available outside the scope of this block. You will need to define the variable properly to access it later.
(require csv-reading)
(require net/url)

(define file
  (get-pure-port (string->url "https://www.travishinkelman.com/data/nycflights.tsv")))

(time
  (define data (csv->list file))
  (void))
; => cpu time: 4366 real time: 9121 gc time: 410
Not very convenient since we get a list of lists that would require some post-processing, but it’s fast enough. Here is a quick benchmark of the data-frame package for the sake of comparison. Note that I converted the TSV to a proper CSV format since this package doesn’t handle other separator.
(require data-frame)

(define file "/home/chl/tmp/nycflights.csv")

(time
  (define data (df-read/csv file #:headers? #t))
  (void))
; => cpu time: 3708 real time: 3708 gc time: 759
Since it doesn’t handle categorical variables or dates (meaning they are stored as raw strings) some procedures like df-describe are pretty useless for variables like carrier, dest, or time_hour, and there’s not much you can do unless you recode then using numeric codes, which is what I ended up doing once. Anyway, there’s a handy tutorial on the author’s website if you want to learn about this package.
Now, here is what we get with tabular-asa:
(require tabular-asa)

(time
  (define data (call-with-input-file "nycflights.csv" table-read/csv))
  (void))
; => cpu time: 7135 real time: 7142 gc time: 1271
It looks like it takes a bit longer to process the whole file, but that’s okay. We’ll get plenty of useful procedures to inspect and munge this dataset.
(define subset (table-cut data '(distance dep_delay dest)))
(display-table subset)
; =>             distance   dep_delay   dest
;            0       1400           2    IAH
;            1       1416           4    IAH
;            2       1089           2    MIA
;            3       1576          -1    BQN
;            4        762          -6    ATL
;           ..        ...         ...    ...
;       336771        213          #f    DCA
;       336772        198          #f    SYR
;       336773        764          #f    BNA
;       336774        419          #f    CLE
;       336775        431          #f    RDU
;
;    [336776 rows x 3 cols]
(table-shape (table-distinct subset '(dest)))
; => 105
     3
(define grouped-data (group-count (table-groupby (table-cut subset '(dest dep_delay)) '(dest))))
grouped-data
; =>          dest   dep_delay
;         0    ABQ         254
;         1    ACK         265
;         2    ALB         419
;         3    ANC           8
;         4    ATL       16898
;        ..    ...         ...
;       100    TPA        7407
;       101    TUL         299
;       102    TVC          96
;       103    TYS         579
;       104    XNA        1011
;
;    [105 rows x 2 cols]
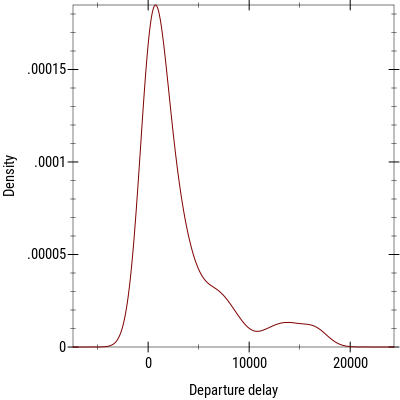
It appears this package provides a load of useful features, which may be familiar to R’s data.table users. We need to be careful since some procedures return a sequence (which you may need to convert to a stream to consume its first or rest values eventually) or a table, depending on the context. With the above grouped data table, we can easily build a kernel density estimate of departure delays with a few additional commands:
(require plot)

(define xs (for/list ([x (table-column grouped-data 'dep_delay)]) x))

(parameterize ([plot-font-face "Roboto Condensed"]
               [plot-font-size 11])
    (plot (density xs)
        #:x-label "Departure delay"
        #:y-label "Density"
        #:out-file "/tmp/plot.png"))
Of course, most of the above grouping and aggregating operations could be performed with the data-frame package. What’s interesting in this case is that author makes heavy use of lazy data structures and relies on a column-major internal representation of rectangular datasets.
♪ Glenn Gould • Goldberg Variations
-
I also came across uke in addition to the packages mentioned in my previous post, and the dataframe package. I will review them when time allows. ↩︎