Cronbach's alpha yet again
As a complement to the references I gave in an earlier post on Cronbach’s alpha, here are some further thoughts.
I am rereading Health Measurement Scales. A practical Guide to their development and use, by D.L. Streiner and G.R. Norman (Oxford Univ. Press, 2008 4th. ed.). I thought it would be a good opportunity to put again some words about Cronbach’s alpha.
This is a very nice textbook on the development and validation of measurement instruments, with a lot of examples in the field of health outcomes or clinical research. Notations are clear and well-explained, and there are some good illustrations. For example, we all know that Cronbach’s alpha depends on the inter-item correlations and the number of items. Their Figure 5.1 (p. 91), which is comparable to what I showed in my earlier post, makes it clear that we can arbitrarily increase α by increasing the number of items in the scale: no need for complex digressions!
Moreover, quoting the authors, who discuss (pp. 90-91) the problem of accepting high values of α during scale development, and interpreting them as reflecting “good” internal consistency:
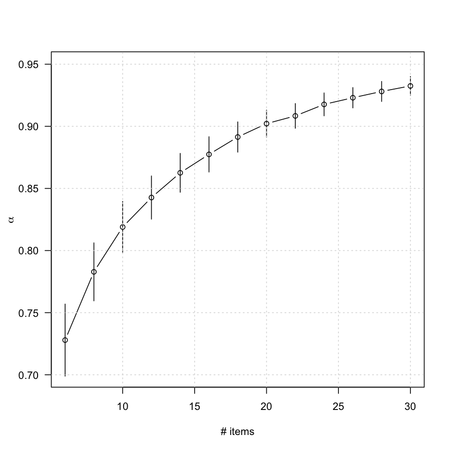
If we have two scales which each measure a distinct construct and combine them to form one long scale, α will be high. Cortina (1993) concluded that, ‘if a scale has more than 14 items, then it will have an alpha of 0.70 or better even if it consists of two orthogonal dimensions with modest (i.e. 0.30) item correlations. If the dimensions are correlated with each other, as they usually are, then alpha is even greater’ (p. 102).
That’s quite easy to check using R. In what follows, we will simulate a two-factor structure, generate 300 scores from it (we could use the correlation matrix directly, though), and compute the average $\alpha$ value observed for 100 replicates when increasing the number of items.
library(nFactors)
sim.data <- function(k) {
  fl <- generateStructure(k, 2, k/2, 0.6, 0.2)
  out <- sim.structure(as.matrix(fl), n=200, raw=TRUE)
  return(out$observed)
}
# check that we get the expected factor structure
# fa(sim.data(14), 2)
nitems <- seq(6, 30, by=2)
res <- sds <- numeric(length(nitems))
for (j in seq_along(nitems)) {
  tmp <- replicate(100, alpha(sim.data(nitems[j]))$total$raw_alpha)
  res[j] <- mean(tmp)
  sds[j] <- sd(tmp)
}
Finally, note that:
if α is too high, then it may suggest a high level of item redundancy; that is, a number of items asking the same question in slightly different ways (Boyle, 1991; Hattie, 1985). This may indicate that some of the items are unnecessary and that the scale as a whole may be too narrow in its scope to have much validity.
This raises the interesting question: What is an acceptable value for $\alpha$? Streiner and Norman conclude with the following:
A number of authors say it should be at least 0.70 (e.g. Heppner et al., 1992; Kaplan and Saccuzzo, 1997). Nunnally (1978) states that this value should be obtained in the early stages of research, but should be at least 0.80 for basic research (a value also endorsed by Carmines and Zeller, 1979; Clark and Watson, 1995; and others) and 0.90 for a clinical instrument. A somewhat different approach is taken by Ponterotto and Ruckdeschel (2007). Because, as we have said, α is influenced by the the length of the scale and the sample size, they propose a range of values dependent on these factors. Therefore, for exmaple, they would call a value of 0.70 ‘good’ for a scale with fewer than seven items, evaluated with fewer than 100 subjects. However, if the scale has more than 11 items, and the sample size was over 300, α would have to be 0.90 to be called ‘good’.
References
Note that I also gave some further references in an answer on stats.stackexchange.com.
- Cortina, J.M. (1993). What Is Coefficient Alpha? An Examination of Theory and Applications. Journal of Applied Psychology, 78(1), 98-104.
- Heppner, P.P., Kivlighan, D.M., and Wampold, B.E. (1992). Research design in counseling. Brooks/Cole, Pacific Grove, CA.
- Kaplan, R.M. and Saccuzzo, D.P. (1997). Psychological testing: Principles, applications, and issues (4th edn.). Brooks/Cole, Pacific Grove, CA.
- Nunnally, J.C., Jr. (1978). Introduction to psychological measurement. McGraw-Hill, New York.
- Carmines, E.G. and Zeller, R.A. (1979). Reliability and validity assessment. Sage, Thousand Oaks, CA.
- Clark, L.A. and Watson, D. (1995). Constructing validity: Basic issues in objective scale development. Psychological Assessment, 7, 309-319.
- Ponterotto, J.G. and Ruckdeschel, D. (2007). An overview of coefficient alpha and a reliability matrix for estimating adequacy of internal consistency coefficients with psychological research measures. Perceptual and Motor Skills, 105, 997-1014.
- Brennan, R.L. (2001). An essay on the history and future of reliability from the perspective of replications. Journal of Educational Measurement, 38, 295-317.
- Graham, J.M. (2006). Congeneric and (essentially) tau-equivalent estimates of score reliability. Educational and Psychological Measurement, 66, 930-944.
- Raykov, T. (1997). Scale reliability, Cronbach’s coefficient alpha, and violations of essential tau-equivalence with fixed congeneric components. Multivariate Behavioral Research, 32, 329-353.
- Boyle, G.J. (1991). Does item homogeneity indicate internal consistency or item redundancy in psychometric scales? Personality and Individual Differences, 12, 291-294.
- Hattie, J. (1985). Methodology review: Assessing unidimensionality of tests and items. Applied Psychological Measurement, 9, 139-164.