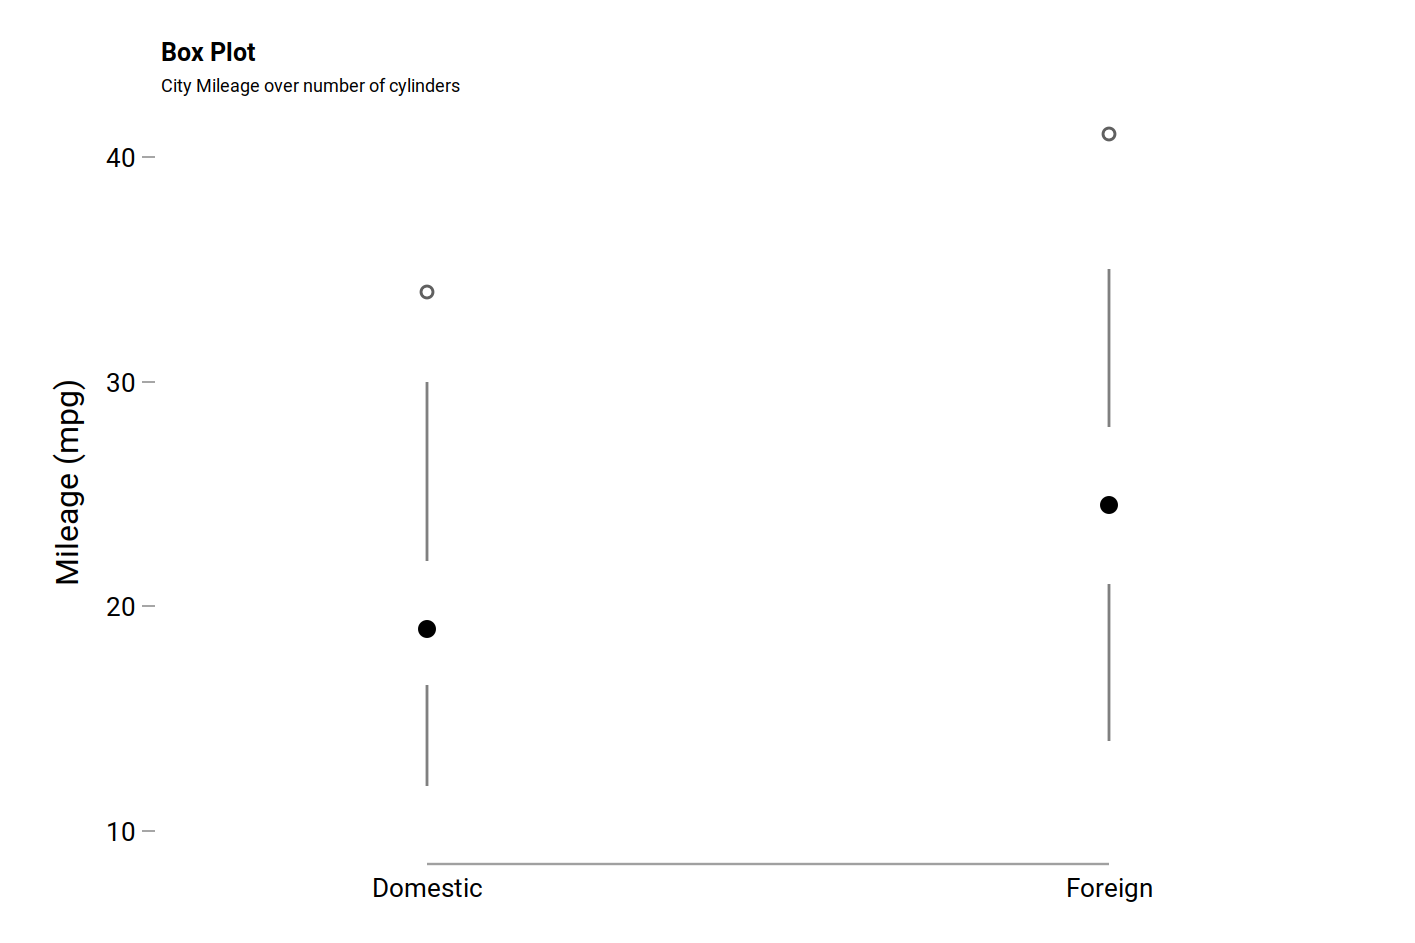
A simplified boxplot, with (much) fewer Stata commands than the one proposed in this old post:
sysuse auto
graph box mpg,  over(foreign) box(1, color(white)) ///
  medtype(marker) medmarker(mcolor(black) mlwidth(0)) ///
  cwhiskers alsize(0) lines(lpattern(solid) lwidth(medium)) ///
  ylabel(, nogrid) yscale(noline) ///
  title("{bf}Box Plot", pos(11) size(2.75)) ///
  subtitle("City Mileage over number of cylinders", pos(11) size(2))
graph export /home/chl/tmp/better-bxp.eps