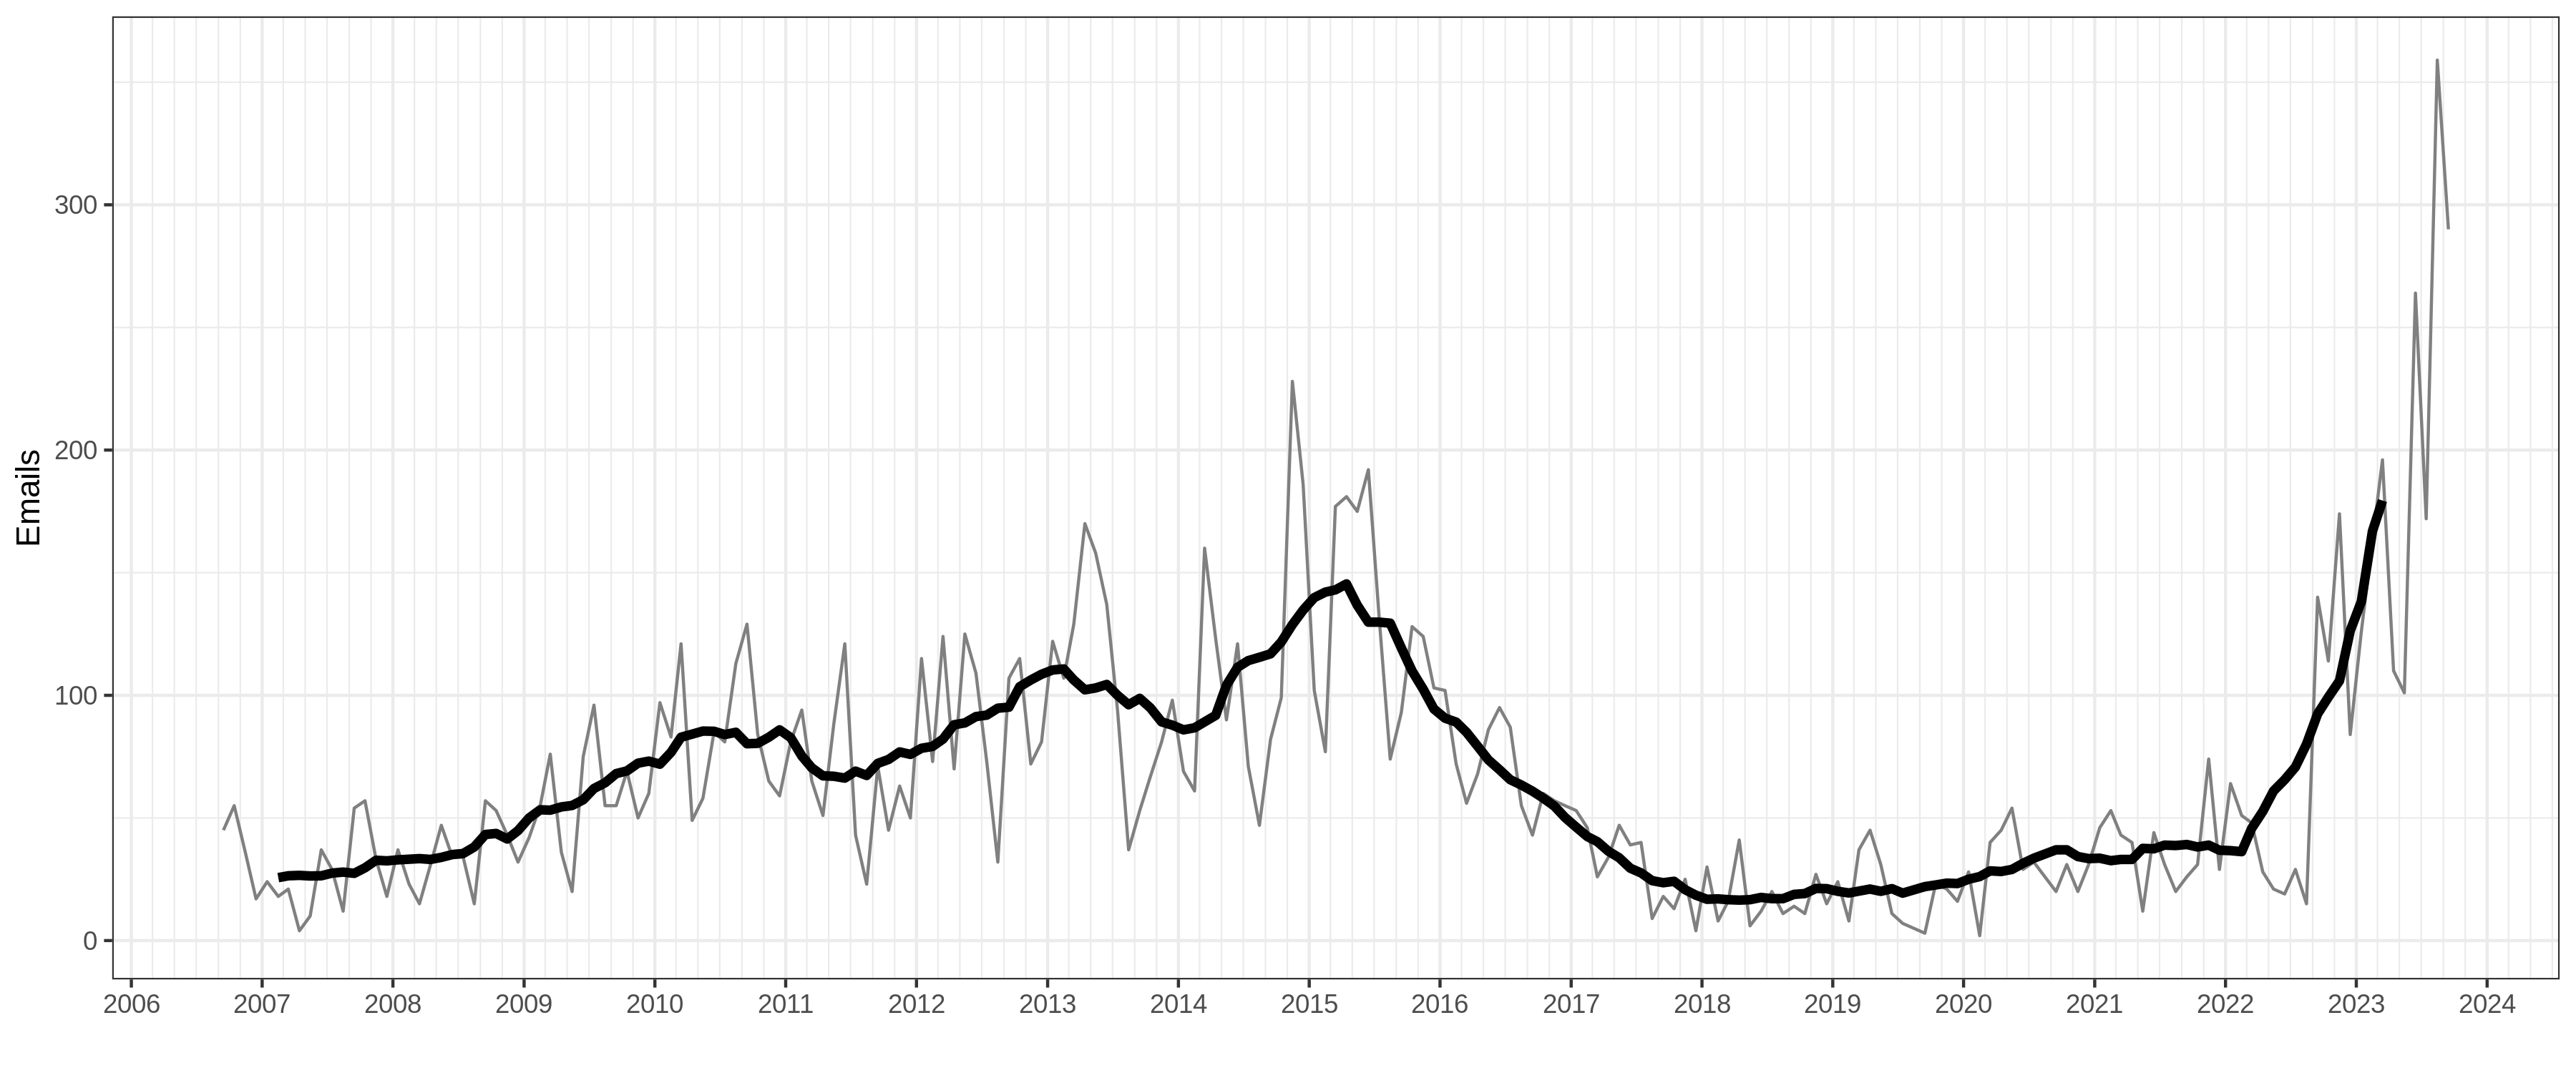
A slightly updated version of all my emails as discussed in a post in 2014. Note that I’ve reduced my mailbox to 20% of its original size since I wrote the blog post, and I keep archiving very few new messages. Also I resubscribed to a bunch of mailing-lists in 2022, which I keep in separate Maildirs but they are included in this chart. I’m still a happy user of mu.
Updated code (because mu-find now uses the system locale to format dates):
$ export LC_ALL=C
$ mu find --sortfield=date --fields="d" date:17y..1d | \
  awk -F " " '{print  $5 "-" $2}' | \
  uniq -c | awk '{print $2 " " $1}' > 1.dat
library(ggplot2)
library(scales)
library(zoo)
Sys.setlocale("LC_ALL","C")
d <- read.table("1.dat", header = FALSE)
d$V1 <- paste(d$V1, "15", sep = "-")
d$V1 <- as.Date(as.POSIXct(d$V1, format = "%Y-%b-%d", tz = "GMT"))
names(d) <- c("Time", "Emails")
p <- ggplot(data = d, aes(x = Time, y = Emails)) +
       geom_line(color=grey(.5)) +
       geom_line(aes(y=rollmean(Emails, 12, na.pad=TRUE)), linewidth = 1.5) +
       scale_x_date(breaks = "1 year", minor_breaks = "2 months",
                    labels = date_format("%Y")) +
       xlab("") +
       theme_bw()
ggsave("allmyemails.png", p, width = 12, height = 5)